app.demobites.com/studio/dashboard-metrics-overview
Bites
Dashboard Metrics Overview
Published
Audio
Original
Custom narration
🇺🇸
ActiveEnglish
Ava Multilingual · azure
Music
Low
Med
High
🇪🇸
Spanish
Elvira Multilingual · azure
🇫🇷
French
Denise Multilingual · azure
Edit Caption
Caption
0:06 – 0:10 · 4.3s
TEXT
Revenue is up 8% — our strongest quarter yet
0:00 / 0:33
AI NARRATIONAva · EnglishUPDATED
“Revenue is up 8%”
GENERATING NARRATION…
Timeline
0:000:040:080:120:160:200:240:280:32
Audio
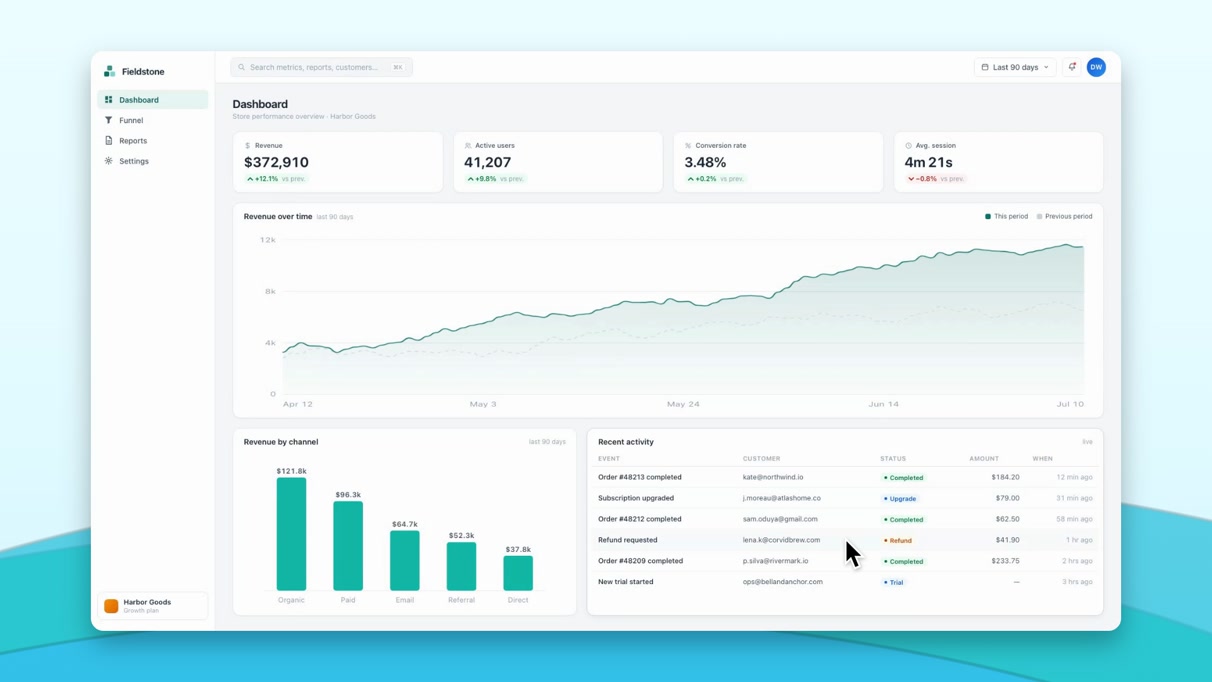
This is the main dashboard.
1.5s
At the top are four key metrics.
2.1s
Revenue is up 8%
4.3s
This chart tracks revenue over time, showing a mostly upward trend.
4.0s
Clicking the date filter updates all the numbers, like the last 7 days.
4.7s
Or select 90 days for the broader picture.
2.4s
Orders update in real time below.
2.1s
And that covers the essentials of the dashboard.
2.3s
Zoom
1.4×
4.0s
1.4×
5.7s
1.4×
3.5s
1.7×
4.0s
Totally free
No watermark